02 Style, images and infographics
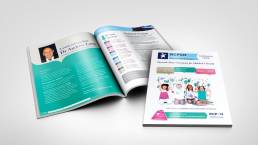
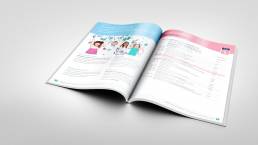
Style, image and structure help create the foundation of an excellent annual report, as report designers we have been producing creative, stylish and artistic annual reports from the very beginning. Each client, brand and business always has a certain style and we like to capture that, tweak and breathe it back in to their annual report. Images, charts and infographics are fundamental to annual report design. The annual report audience is becoming more diverse and that is why information needs to be presented in a way that is engaging and understandable. As a skilled infographic designers, we can transform any information, break it down into digestible chunks and stylise it into an image, chart or diagram.
1. Style
Adhering to branding guidelines is the first step in the annual report design process, figuring out how far some of the colours and tones can be pushed and used if at all. Once this has been understood basic concepts can be put together, that then becomes the template for the rest of the annual report.
2. Structure
How much text, how many images, photos or diagrams are required? With regards to layout where and on how many pages will there be a requirement for a diagram, infographic or chart?
3. Images
The easiest option is to use in house images if you have them. If not, photography is a good choice as these images will be exact and personal to your brand and business. Plus, these images will be credited to you and can be used elsewhere too. The final option is stock images, which although they are generic, they are still vital to illustrate your annual report.
4. Infographic designers
If infographic design is considered then that is a bonus, dissecting information and turning it in to an image form makes annual reports look fun and make them interesting to read. Ensure that there isn’t too much information or that the design doesn’t take over the key messages of the infographic design. We have designed numerous infographics and being an infographic design specialists, our motto is always keep it simple and use easy to understand symbols to help explain key points.
5. Charts and diagrams
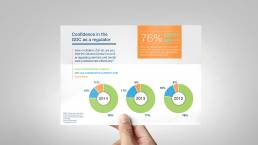
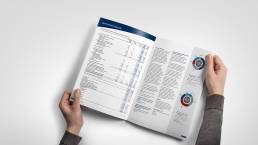
These are thoroughly important and as your annual report designer we recommend they be included especially if you have data, statistics or any numbers that need to be shown. Creativity is essential in ensuring dull numbers get transformed into easy to understand and beautifully designed charts and diagrams.
Do you have an urgent deadline?
Recent Projects

